Adjusting Forecasts
Using the Forecast Analysis page, forecast adjustments can be made at the SKU level or at an aggregate level. When making adjustments at an aggregate level, all pairs listed will be adjusted proportionately.
Click here for information about viewing forecast value.
1. Enter Forecast in the Go to box to search for the page, then select the page from the resulting list of matches. The Forecast page appears.
The Forecast Analysis page appears.
2. The Filter Records By section lets you filter on the pairs you want to adjust. Set the selection criteria in the Filter Records By section as follows:
◦ Part: If you want to see the forecast for one part only, select the part. If you want to see the forecast for all parts, leave the field blank or click the Clear icon  to clear the field.
◦ Location: If you want to see the forecast for one location only, select the location. If you want to see the forecast for all locations, leave the field blank or click the Clear icon to clear the field.
◦ Forecast Stream: Select a forecast stream from the drop-down menu.
You cannot select All when adjusting forecast. |
◦ Filter: Select an advanced filter to use. To create a new advanced filter, click the Go To Advanced Filters icon  .
.
.◦ Display Options: Select Units.
You must select Units to adjust forecast; when Value is selected, adjustments are not allowed. |
3. Click the Filter Records icon  . The pairs matching your criteria are listed on the page with a slice-by-slice summary of the forecast for all filtered pairs that have a forecast.
. The pairs matching your criteria are listed on the page with a slice-by-slice summary of the forecast for all filtered pairs that have a forecast.4. Set the dates you want the adjustments to take effect by selecting dates for the Start Date and End Date fields. For example, if you wanted to change the forecast for January, February, and March of 2010, you would select January 1, 2010 for the Start Date and March 31, 2010 for the End Date.
5. Use one of the following methods to adjust forecast units:
◦ Set method - use to adjust forecast to an absolute value. In this case, total forecast (Raw Forecast + Forecast Adjustment) will equal the Set value.
◦ Relative method - use to adjust forecast for each slice by a set number of units.
◦ Percent method - use to adjust forecast for each slice by a set percentage.
◦ Extended Percent method - use to ramp the forecast up or down using an extended percent value.
As you use these adjustment methods remember that your adjustments will be applied to all pairs listed on the page. So, if you only have one SKU listed, only that SKU will be adjusted. But, if you have multiple pairs listed, adjustments will be divided proportionately across the pairs.
Also, note that you can click the Expand icon  for a row to see the Adjustment and Aggregate Totals rows for the SKU in the grid.
for a row to see the Adjustment and Aggregate Totals rows for the SKU in the grid.You can only see the Expand icon when Display Options is set to Units in the Filter Records By section |
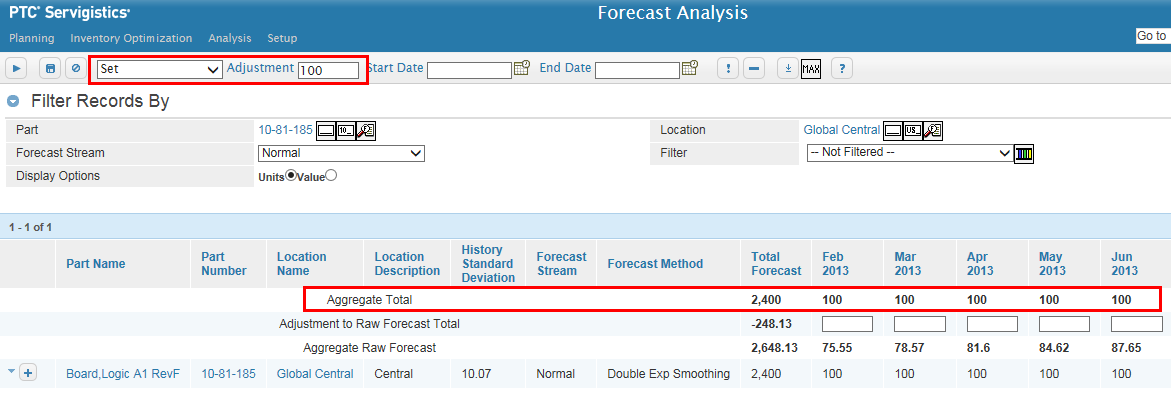
Set Method
Set the Adjustment Method box to Set, enter the exact amount of forecast you want to apply to the slices within the selected time period in the Adjustment box, and click the Process icon  . Servigistics makes forecast adjustments so that Raw Forecast + Forecast Adjustment equals the Set absolute value for the slices n the selected time period.
. Servigistics makes forecast adjustments so that Raw Forecast + Forecast Adjustment equals the Set absolute value for the slices n the selected time period.Entering a negative value when using an absolute value (Set) will make the forecast for the selected time period zero (0) since forecasts cannot be negative. |
Relative Method
Set the Adjustment Method box to Relative, enter the forecast adjustment amount (positive or negative) you want to apply to the slices within the selected time period in the Adjustment box, and click the Process icon . Servigistics increases or decreases the Adjustment to Raw Forecast Total by the relative amount for the slices within the selected time period.
. Servigistics increases or decreases the Adjustment to Raw Forecast Total by the relative amount for the slices within the selected time period.For example, you could set the forecast to increase 20 units for each slice within the selected time period:
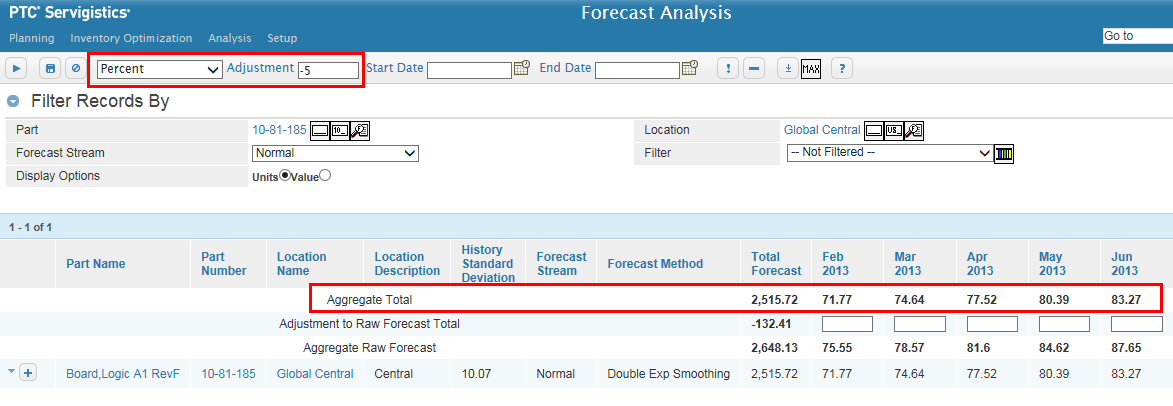
Percent Method
Set the Adjustment Method box to Percent, enter the percentage (positive or negative) of forecast you want to apply to the slices within the selected time period in the Adjustment box, and click the Process icon . Servigistics increases or decreases the Raw Forecast amount by the set percentage for the slices within the selected time period.
. Servigistics increases or decreases the Raw Forecast amount by the set percentage for the slices within the selected time period.For example, you could set forecast to decrease 5% for each slice within the selected time period:
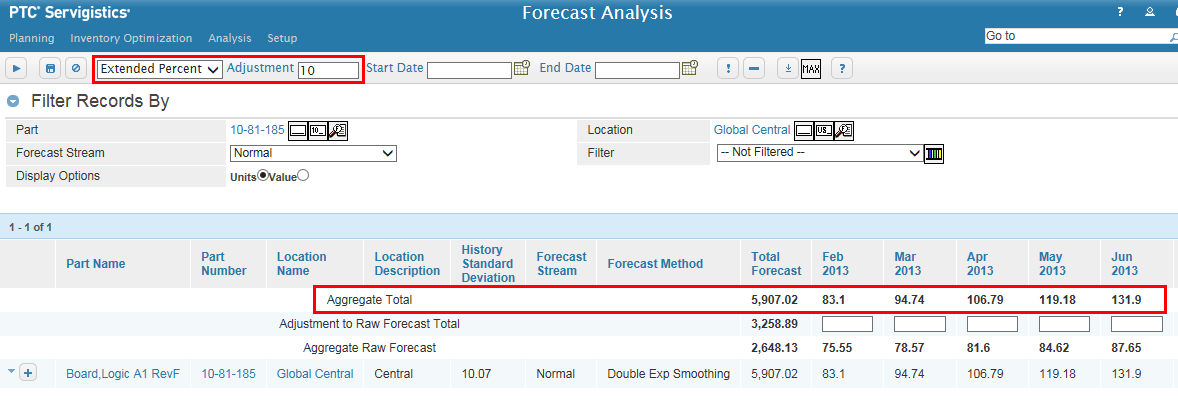
Extended Percent Method
The extended percent method gradually increases or decreases forecast by a set percentage. For example, if you set extended percent to 10%, you might see results like this:
Forecast | Jan | Feb | Mar | Apr | May |
|---|---|---|---|---|---|
Raw Forecast | 100 | 100 | 100 | 100 | 100 |
Scale Factor | 10 | 11 | 11.1 | 11.11 | 11.111 |
Adjustment | 10 | 21 | 32.1 | 43.21 | 54.32 |
Adjusted Forecast | 110 | 121 | 132.1 | 143.21 | 154.32 |
In the above example Total Forecast = Raw Forecast + Adjustment where:
Total Forecast = Aggregate Total
Adjustment = Adjustment to Raw Forecast Total
Raw Forecast = Aggregate Raw Forecast
Scale factor in Jan = 10% of Raw forecast in Jan = 10% of 100 = 10
Scale factor in Feb = 10% of (Raw forecast in Feb + Scale factor in Jan) = 10 % of (100 + 10) = 11
Scale factor in Mar = 10% of (Raw forecast in Mar + Scale factor in Feb) = 10 % of (100 + 11) = 11.1
Scale factor in Apr = 10% of (Raw forecast in Apr + Scale factor in Mar) = 10 % of (100 + 11.1) = 11.11
Scale factor in May = 10% of (Raw forecast in May + Scale factor in Apr) = 10 % of (100 + 11.11) = 11.111
Scale factor in Jun = 10% of (Raw forecast in Jun + Scale factor in May) = 10 % of (100 + 11.111) = 11.1111
Adjustment in Jan = Scale factor in Jan + Previous month's adj = 10 + 0 = 10
Adjustment in Feb = Scale factor in Feb + Previous month's adj = 11 +10 = 21
Adjustment in Mar = Scale factor in Mar + Previous month's adj = 11.1 +21 = 32.1
Adjustment in Apr = Scale factor in Apr + Previous month's adj = 11.11 +32.1 = 43.21
Adjustment in May = Scale factor in May + Previous month's adj = 11.111 +43.21 = 54.321
Adjustment in Jun = Scale factor in Jun + Previous month's adj = 11.1111 +54.321 = 65.432
Total Forecast in Jan = Raw Forecast in Jan + Adjustment in Jan = 100 + 10 = 110
Total Forecast in Feb = Raw Forecast in Feb + Adjustment in Feb = 100 + 21 = 121
Total Forecast in Mar = Raw Forecast in Mar + Adjustment in Mar = 100 + 32.1 = 132.1
Total Forecast in Apr = Raw Forecast in Apr + Adjustment in Apr = 100 + 43.21 = 143.21
Total Forecast in May = Raw Forecast in May + Adjustment in May = 100 + 54.321 = 154.32
Total Forecast in Jun = Raw Forecast in Jun + Adjustment in Jun = 100 + 65.432 = 165.43
Scale Factor is not displayed anywhere on the Forecast Analysis page. |
Set the Adjustment Method box to Extended Percent, enter the extended percentage (positive or negative) of forecast you want to apply to the slices within the selected time period in the Adjustment box, and click the Process icon . Servigistics increases or decreases the Raw Forecast amount by the set extended percentage for the slices within the selected time period.
. Servigistics increases or decreases the Raw Forecast amount by the set extended percentage for the slices within the selected time period.For example, you could set the forecast to increase extended 10% for each slice within the selected time period:
6. After you have used one of the methods to adjust the forecast, review your results. If desired, you can make manual tweaks to individual slices by entering a new absolute forecast value in the editable boxes.
7. Click the Save icon  to save any adjustments you made.
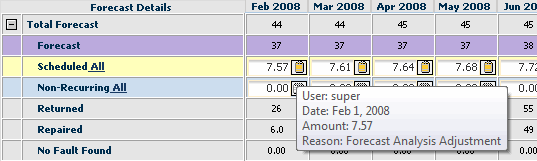
to save any adjustments you made.8. When an adjustment is made through the Forecast Analysis page, an adjustment reason note is automatically added to the adjusted amount on the Demand page. You can confirm your changes by checking the adjusted pairs on the Demand page. When you hover over the Edit Note icon  for the adjusted forecast amount, a message appears indicating that the original forecast amount was adjusted through the Forecast Analysis page.
for the adjusted forecast amount, a message appears indicating that the original forecast amount was adjusted through the Forecast Analysis page.