Understanding and Using Dashboards
The Performance Analytics and Intelligence (PAI) application has many dashboards that enable you to see global information with drill-down capabilities.
What is a Dashboard?
A visual organization of important information from multiple data sources. A dashboard is comprised of two components:
• Measures
Together, the dimensions and measures visually communicate the metrics to help users understand complex relationships in their data. Dashboards enable the users to draw parallels between different but related metrics, identify trends, and address potential problems in a proactive manner.
What is a Dimension?
The qualitative component of a dashboard that can be grouped. For example:
• Location
• Part Family
• Part Type
What is a Measure?
The numeric component of a dashboard that supports mathematical functions, such as aggregation and averaging. For example:
• Backorders
• On Order
• Profit
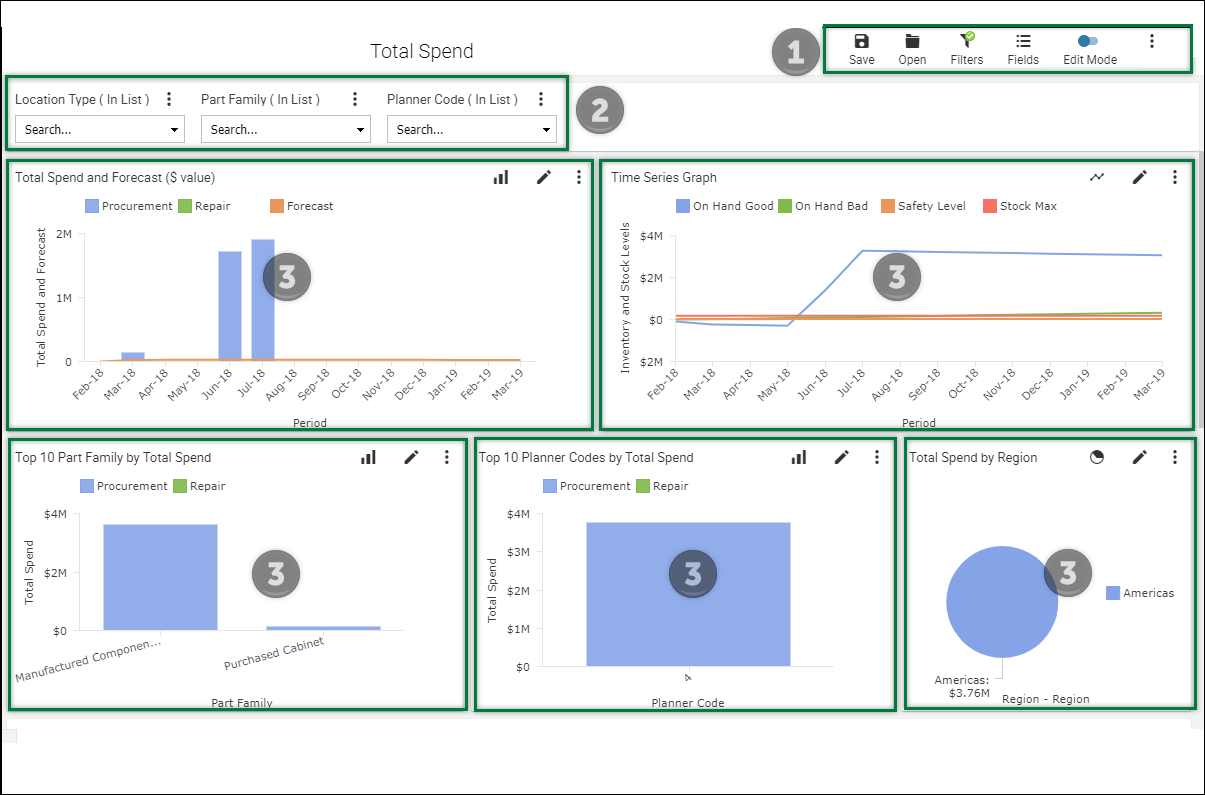
What does a Dashboard look like?
Each Dashboard has these three sections:
1. Toolbar
2. Filters
3. Widgets
Learn more about using Dashboards