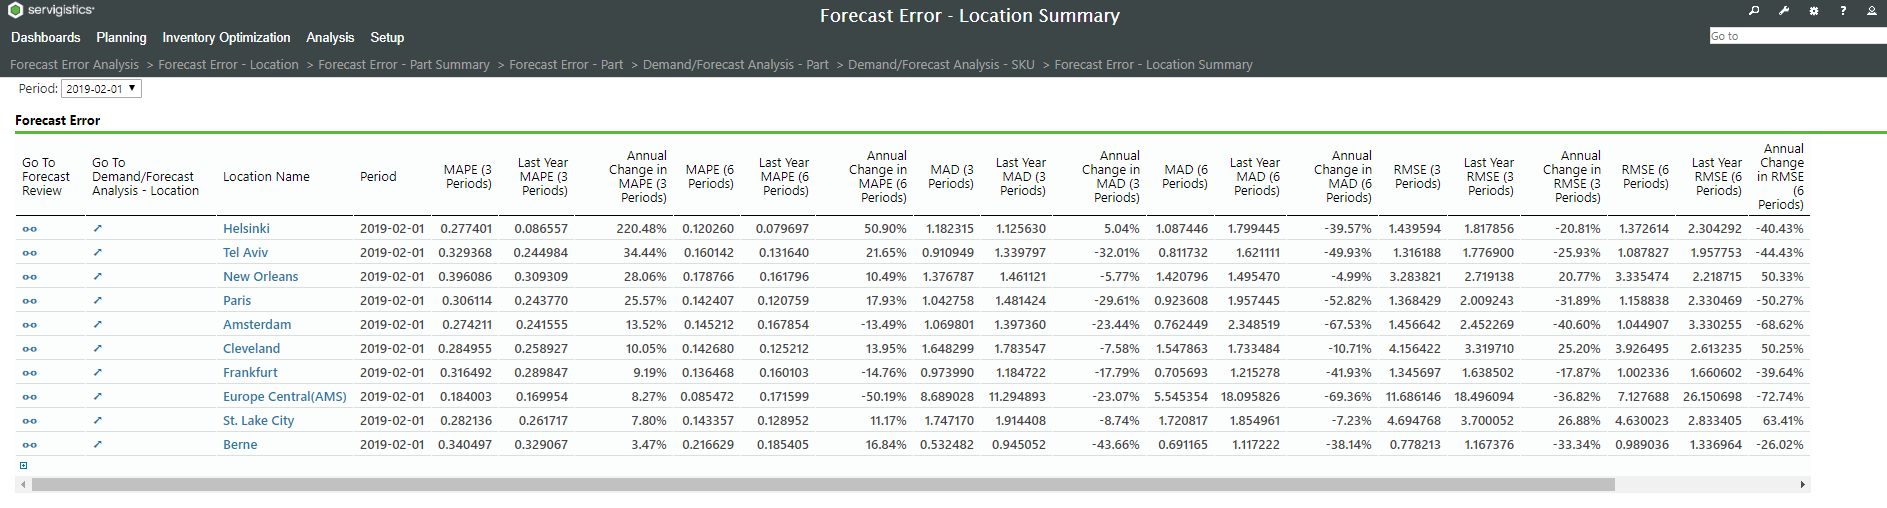
Forecast Error - Location Summary Dashboard
This is a system level dashboard that shows summaries of all locations in the system. It includes MAPE, MAD and RMSE calculated over 3-months and 6-months both for current date as well as comparison to last year value. This dashboard is sorted by maximum increase in error, to enable the planner to concentrate on the locations where the error became worse compared to last year.
See also