Demand/Forecast Analysis - Location Dashboard
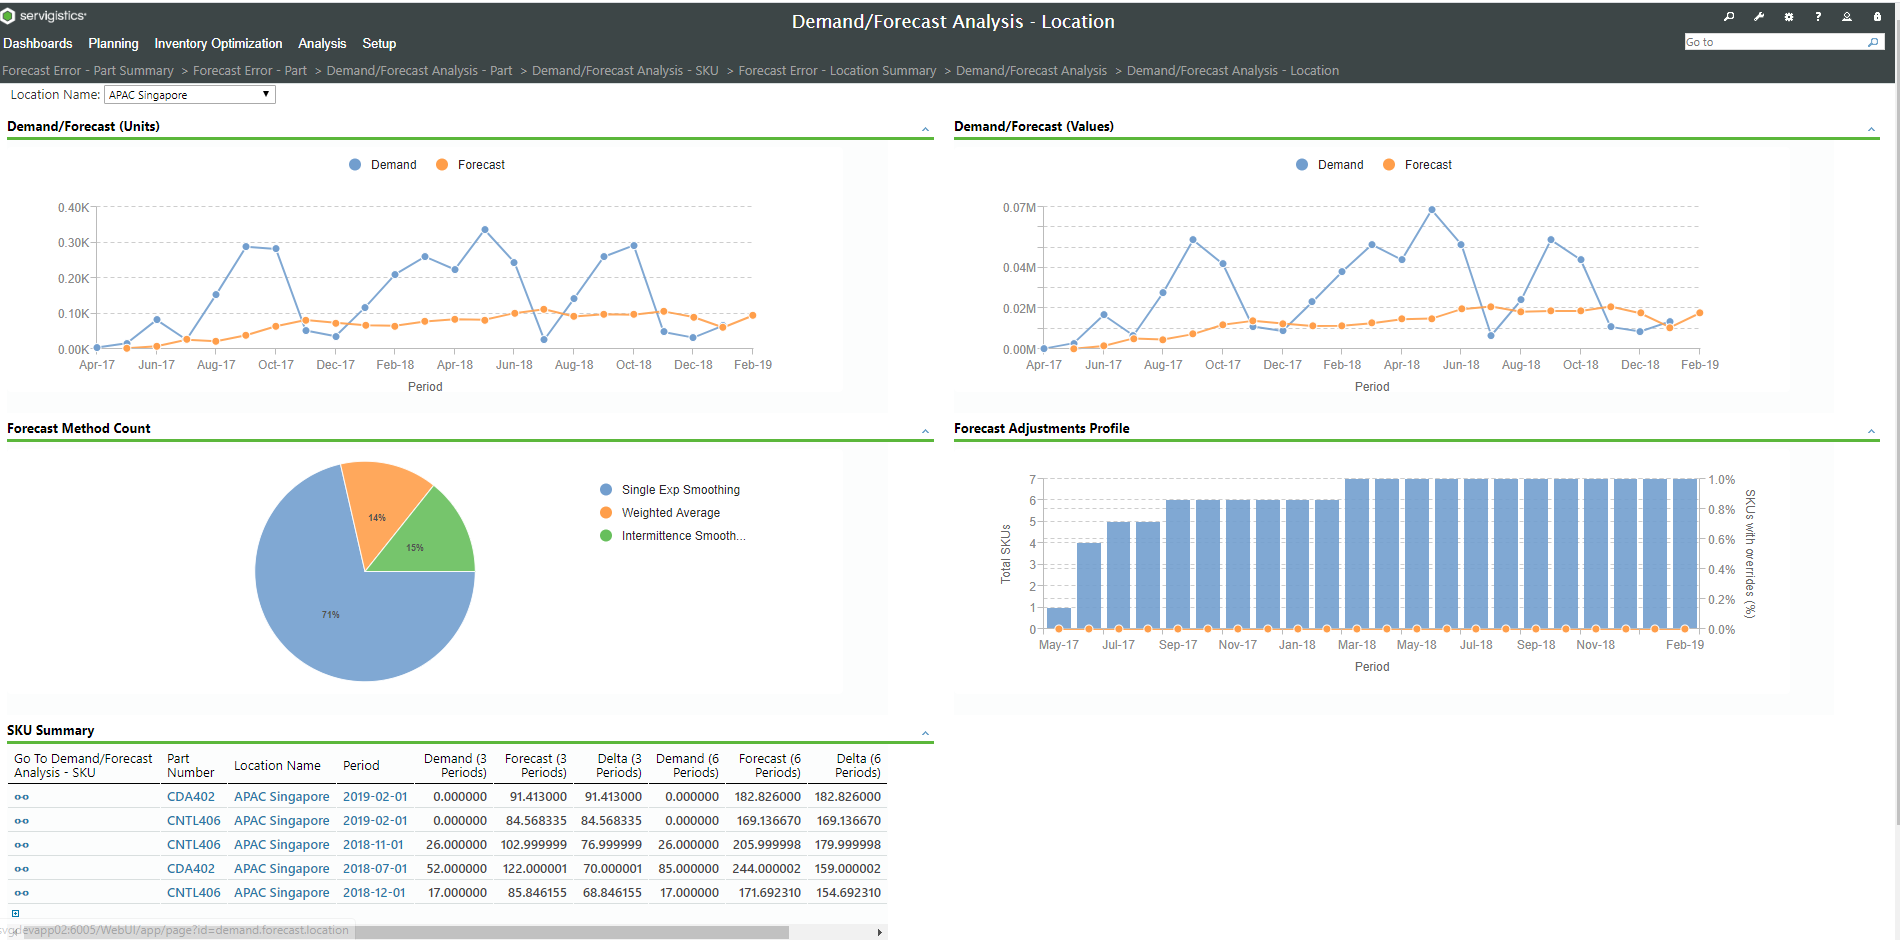
This is a location level dashboard that has time series view of demand and forecast at the top both in units as well as values.
It also contains the forecast method count container which gives idea of what all methods are being used at that locations. It helps to infer what are the different demand patterns existing at the location.
In the forecast adjustment profile section, it highlights the total number of SKUs at that location, and the percentage of SKUs that are overridden over time.
In the SKU summary section, information related to 3-months and 6-months of demand/forecast for all the SKUs are shown sorted by descending order of the difference between demand and forecast.
See also