Levels Calculations
The calculation of levels depends on two models: Measure of Effectiveness (MOE) and Volume.
Measure of Effectiveness (MOE)
Measure of Effectiveness (MOE) has two metrics:
Type I
Type I (Probability of No Stock Out Service) is the probability that no stock out occurs any time during an order cycle. A stock out is defined as an occasion when the on hand stock drops to zero level. For example, if you plan for a 90% DS using Type I, you are implying that the fraction of the replenishment cycle in which a stock out does not occur is 90%. Type I is often used for more expensive or critical parts.
Type II
Type II (Fill Rate Service) is the average percentage of quantity demand satisfied immediately from on hand inventory over the long run. For example, if you plan for a 90% DS using Type II, you are implying that over any number of order cycles you should be able to provide 90% of the requested pieces.
Type I vs. Type II
For Type II Safety Stocks, the larger the order quantity, the smaller the Safety Stock required in order to meet a fill rate target. If order quantity is large, many customers have their demand satisfied before there is even an opportunity for a stock out. In many instances, the use of Type II results in smaller Safety Stock quantities because larger order quantities reduce the need for Safety Stock. The larger the order quantity, the smaller the Safety Stock required in order to meet a fill rate target. This difference is due to the fact that if the order quantity is large, many customers have their demand satisfied before there is even an opportunity for a stock out.
Type I service only considers demand satisfaction in calculating safety quantities and, thus, is not directly affected by order sizes. Also, when the on hand stock level drops to zero, Type I will not get any credit for the service level, while Type II may get credit since it is based on backorder. Even if the on hand quantity drops to zero, a backorder may not exist if there is no demand during the cycle.
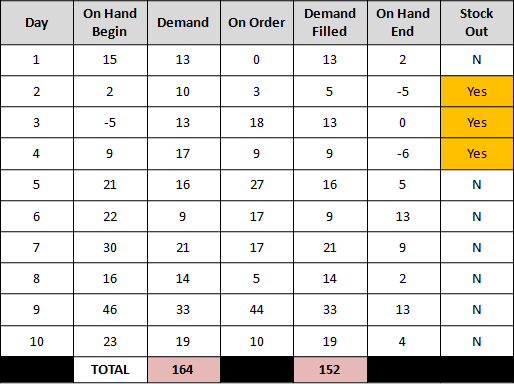
In the following table, the replenishment cycle is 10 days and the on-order amount is accounted at the beginning of the day. The two types of Measures of Effectiveness (MOE) come up with vastly different results from the same data:

• For Type I, in the column on the right, there are three occasions of stock out during the ten order cycles. The probability of no stock out during the overall cycle = 7/10 = 70%.
• For Type II, in the bottom row, there was a total demand of 165 units, of which 152 units were filled immediately from on hand stock. The average percentage of unit demand filled immediately = 152/165 = 92%.
Using Type II Fill Rate When EOQ = 1
Volume has two metrics: High and Low.
For low volume SKUs, the default behavior is to use Type I fill rate for Type II fill rate when EOQ = 1. However, LEVELS_TYPE2_TREAT_EOQ_ONE_AS_USUAL global setting changes that behavior. When this global setting is set to true, Type II fill rate will calculate as usual when EOQ = 1. Please contact your business/systems analyst for help changing global settings.
High-Volume vs. Low-Volume
Volume, as calculated by Servigistics, reflects the value of lead time demand forecast, which is the average amount of stock needed during the lead time.
For a high-volume part, a normal distribution model is assumed. However, since a normal distribution is continuous, inaccuracies become pronounced in low volume situations. Two discrete distributions are used for low volume parts: Poisson (low variability) and Negative Binomial (high variability). In both cases, as the mean increases the distribution converges to normal.
The high volume-low volume distinction is with reference to the lead time or pipeline forecast of parts. Specifically, demand volume is measured in terms of the number of units demanded.
For low volume calculations the difference between ROP and Safety Stock is not always equal to demand over lead time. Parts with a pipeline forecast less than the threshold value in the global setting are considered low volume, and parts with pipeline forecast higher than the threshold value in the global setting are considered high volume.
If the Variance to Mean Ratio (VMR) is greater than the value of the SL_LOW_VOL_VMR_THRESH global setting , the negative binomial distribution method is used to calculate the levels. If the VMR is less than or equal to the global setting, the Poisson distribution method is used to calculate the levels.
The pipeline forecasts quantities are adjusted by order period forecast quantities if order periods are modeled. |
Implementor Note
The SL_LOW_VOL_VMR_THRESH global setting controls the value at which the forecasted demand over lead time is considered low or high volume. Any value above 25 is automatically considered high volume.
The switch between Negative Binomial and Poisson is controlled by the calculated Variance to Mean Ratio (VMR). If it is higher than the value specified in the SL_LOW_VOL_VMR_THRESH global setting, it uses negative binomial, Poisson otherwise. However, any time there is a VMR of one or less, it will use Poisson.
Additionally, the maximum value that VMR can take is capped by the value of one of two global settings, SL_LOW_VOL_VARIABILITY_CAP or SL_HIGH_VOL_VARIABILITY_CAP. These settings control the effect of excessively high varying demand when generating Safety Stock quantities. The default value is 9 for low volume cap and 30 for high volume cap. Any value above one (1) is valid. This value only affects the negative binomial distribution for low volume SKUs. For example, a cap of 9 means standard deviation of demand over lead time = sqrt(9 * demand over lead time).
High-Volume vs. Low-Volume Detection
Servigistics follows this process in determining whether a part is high-volume or low-volume:
1. Servigistics compares demand over the lead time with the SL_LOW_VOL_THRESH value. If demand over lead time is greater than SL_LOW_VOL_THRESH, Servigistics uses a normal (high-volume) distribution otherwise it is low-volume.
2. If the SKU is low-volume, then Servigistics determines the type of distribution to use in the calculation: Poisson or negative binomial. Servigistics compares the calculated VMR with SL_LOW_VOL_VMR_THRESH. If VMR is greater than SL_LOW_VOL_VMR_THRESH, Servigistics uses negative binomial (otherwise Poisson).
What Affects the Levels Calculations
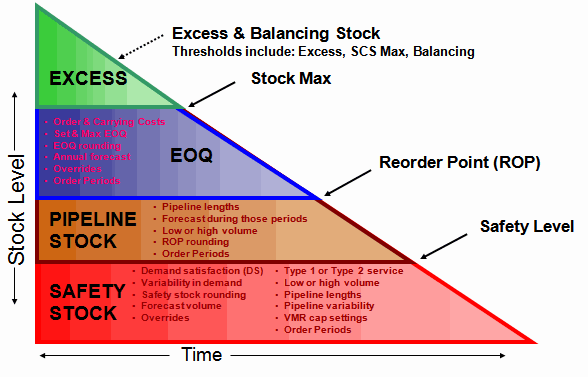
Four stock levels affect the levels calculations:
• Safety Stock
• ROP
• Stock Maximum
• Excess & Balancing Stock

Levels Calculations Results
Results of levels calculations can be viewed on the Optimal Levels page and on the Planner Worksheet's Monthly View. On the Optimal Levels page, levels calculation results come from IPCS_STOCK_LEVEL. On the Planner Worksheet, levels calculation results come from IPCS_ORDER_PLAN_NETFCST.