Linear Regression Forecast Method
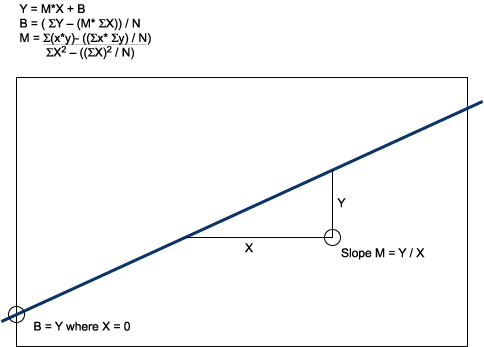
While Linear Regression is more complex than averaging, it is the simplest forecast method for recognizing trends It is more likely to produce an accurate forecast for items that show a definite increase or decrease in demand. As illustrated in the following chart, this method uses mathematics to analyze the demand data to produce a description of a line by calculating the slope or rate of change and the intercept or where the line crosses the y axis. With these two values, demand can be forecasted using the formula y = mx + b. The Linear Regression forecast method requires a minimum of one month of demand history.

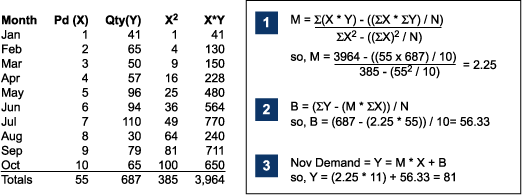
The following example illustrates using linear regression where the slope and intercept are calculated to describe the demand for 10 months for a part, and then November demand is predicted using those values.

Each forecast method has constraints, called best fit rules that may make it ineligible for forecasting. |